
Briefing Charts


Bespoke route & weather charts
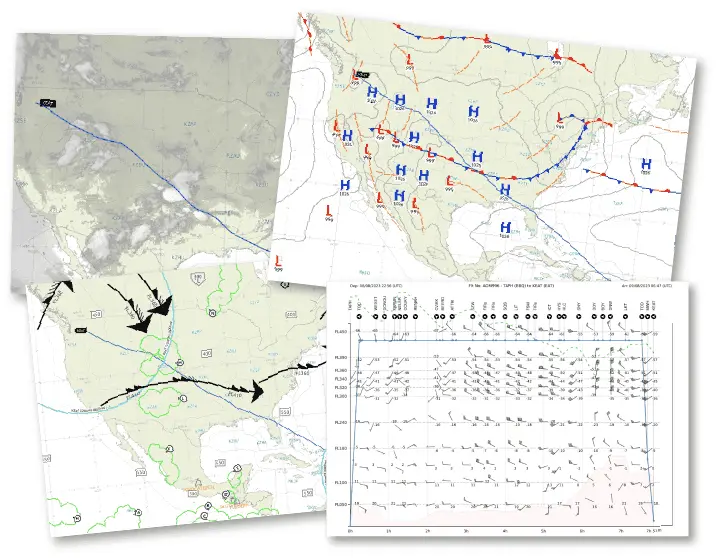
Automatically generate the aviation route charts and weather charts that are needed for each flight sector briefing pack.
By integrating your OFP and using the most trusted weather data feeds, skybook creates unique briefing charts such as:
- Satellite infrared route charts
- Surface weather analysis chart
- Vertical profile flight charts
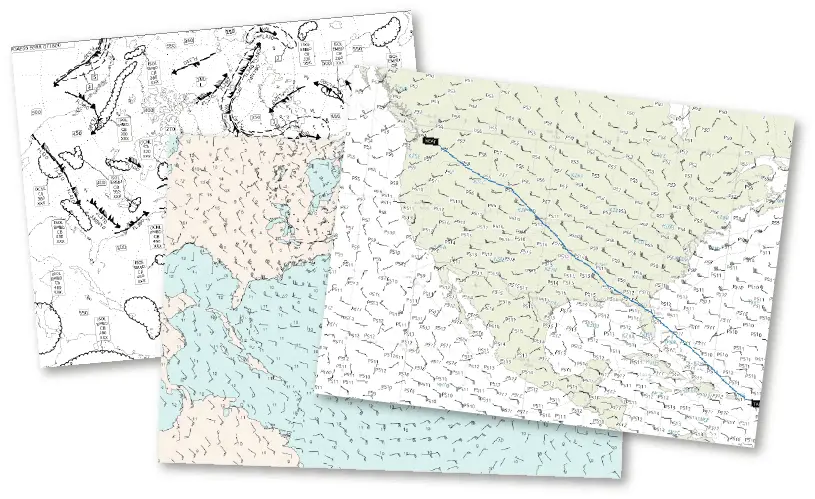
Upper wind charts
Our flight briefings include a comprehensive range of upper wind & temperature charts, significant weather charts, Hurricane tropical reports and environmental charts.
Most of the aviation weather charts include other info such as flight level, OFP number and the validity period.
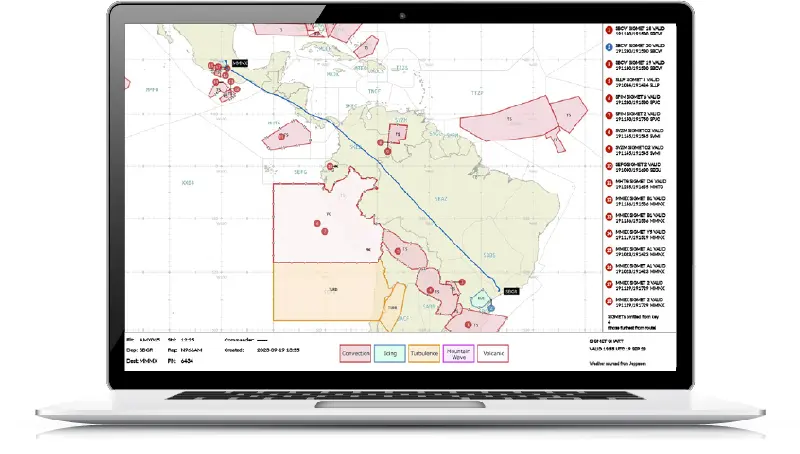
SIGMET route charts
SIGMET route charts that feature numerical labels on the planned flights proximity to the route.
These labels refer to awareness of either:
- Convection
- Icing
- Turbulence
- Mountain wave
- Volcanic
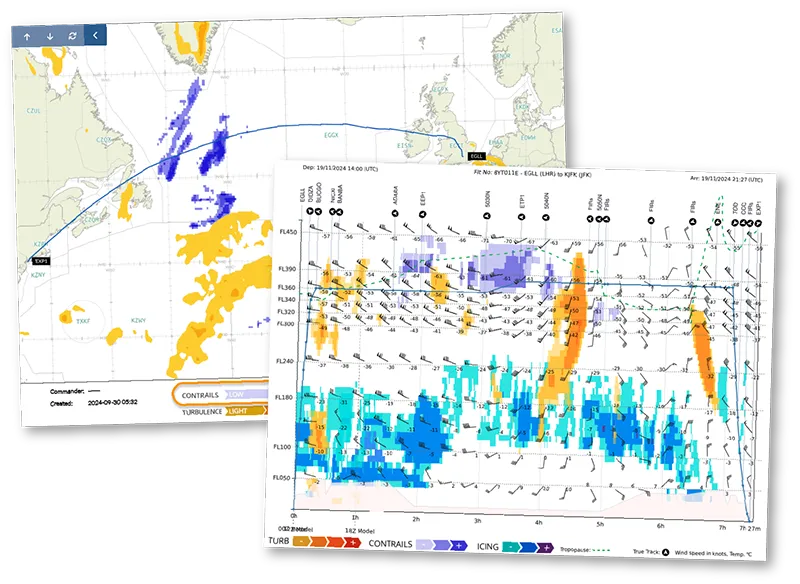
Turbulence & Contrails
Our turbulence and contrail charts now include Google’s predictive AI contrail data, enabling operators to see where persistent contrails are likely to form.
Turbulence and icing charts can be viewed at multiple flight levels for improved awareness.
EFB Charts
Pilot briefing charts
Flight crew gain access to all of the aviation weather charts and route information above, via the briefing section of the EFB app.
Our award-winning EFB also includes digital OFP, airfield & NOTAM data, sector attachments and flight phase journey logging...
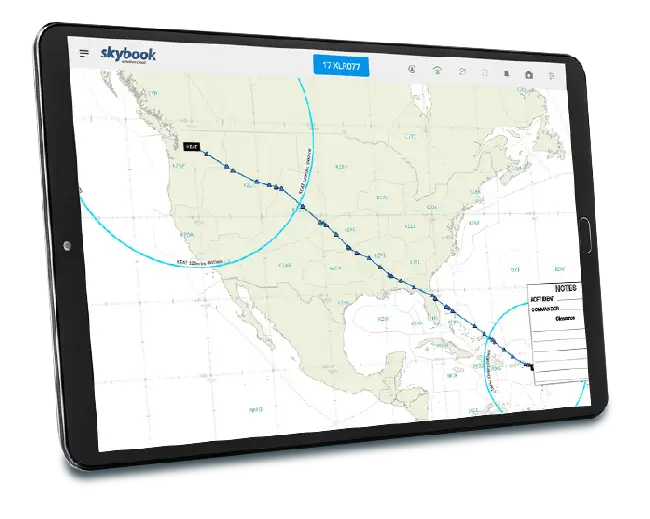
Interactive EFB chart
The skybook EFB takes flight briefing charts to the next level, with our intuitive global weather and route map.
This EFB map is essentially an interactive operational flight plan. Featuring planned position data, flight levels, weather layers, airfield data, and much more.
Restricted area charts
Restricted areas are also able to be displayed on our charts with colour coding. Such as no flyzones or hard restricted areas.
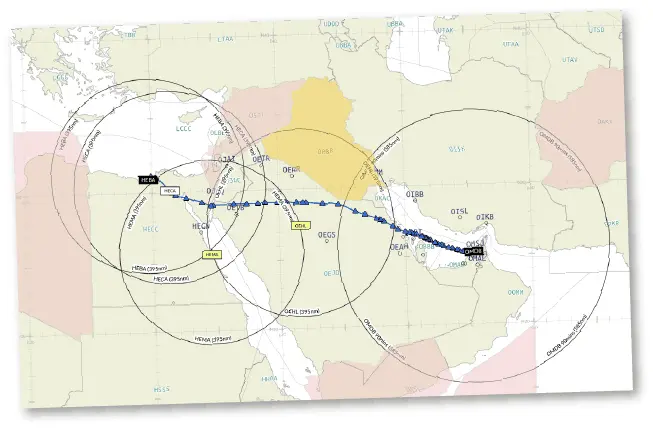
skybook also automatically creates custom ETOPs charts that are fully compliant and included in the pilots briefing packs.